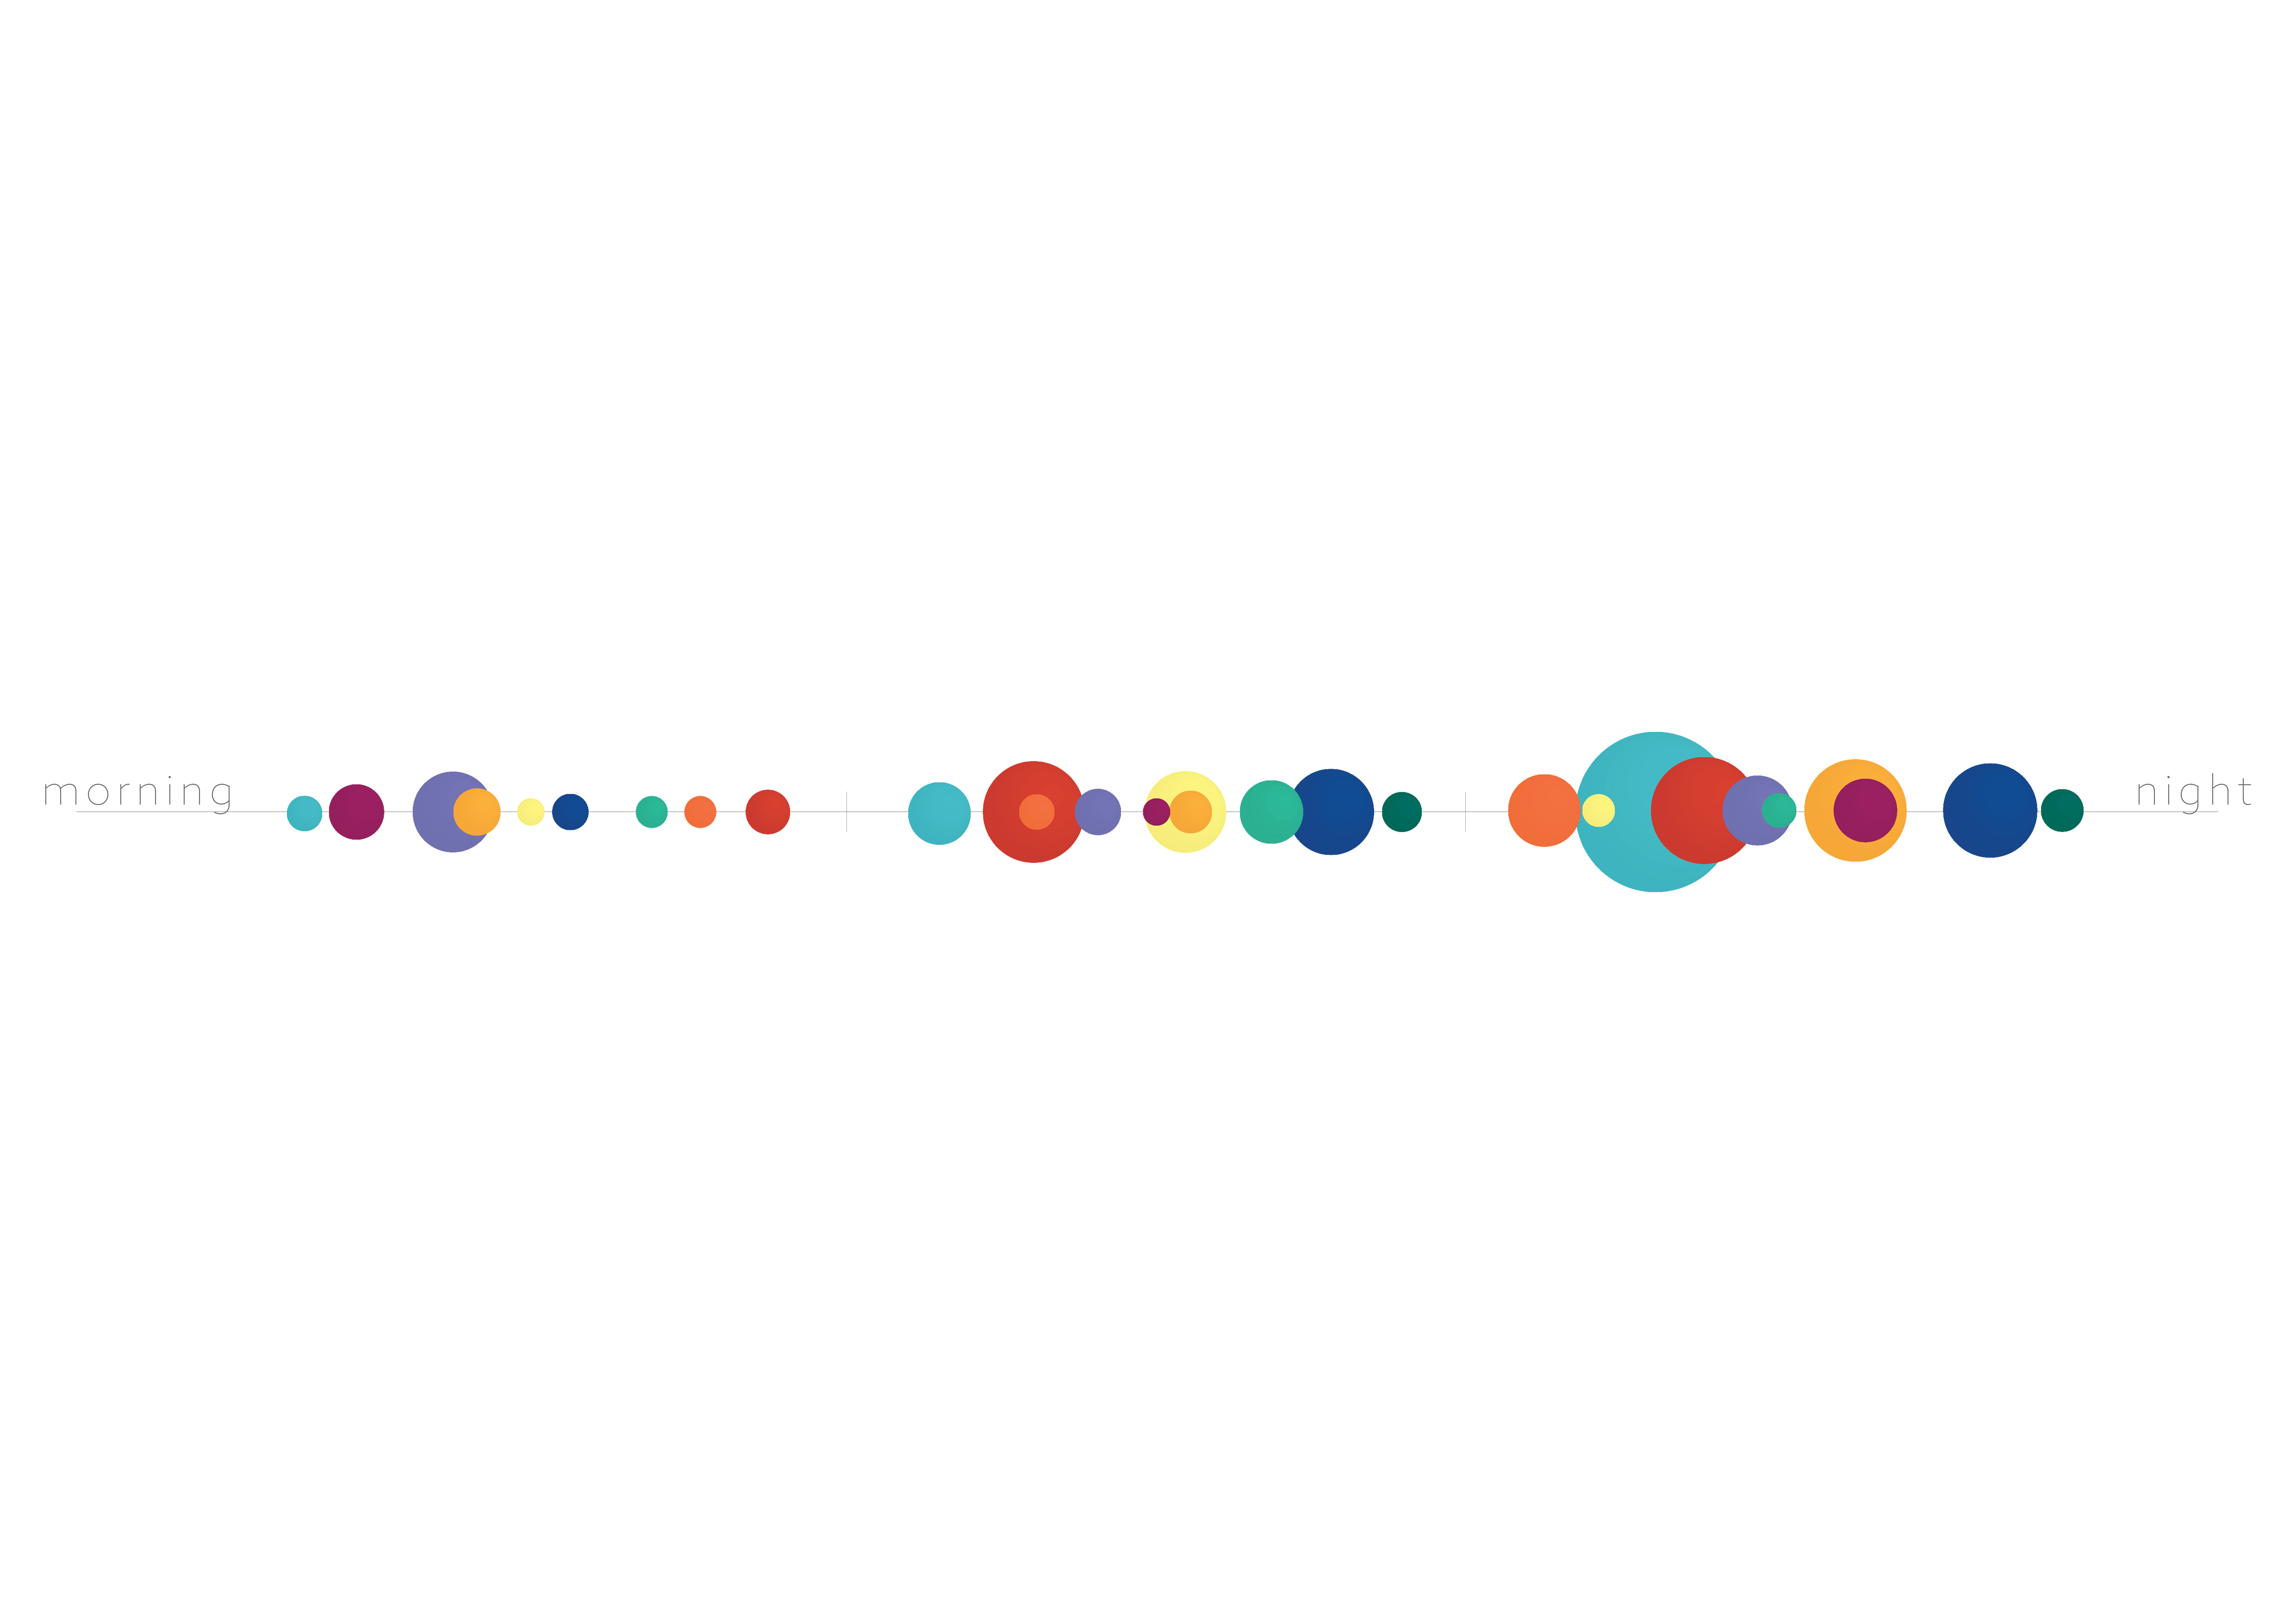
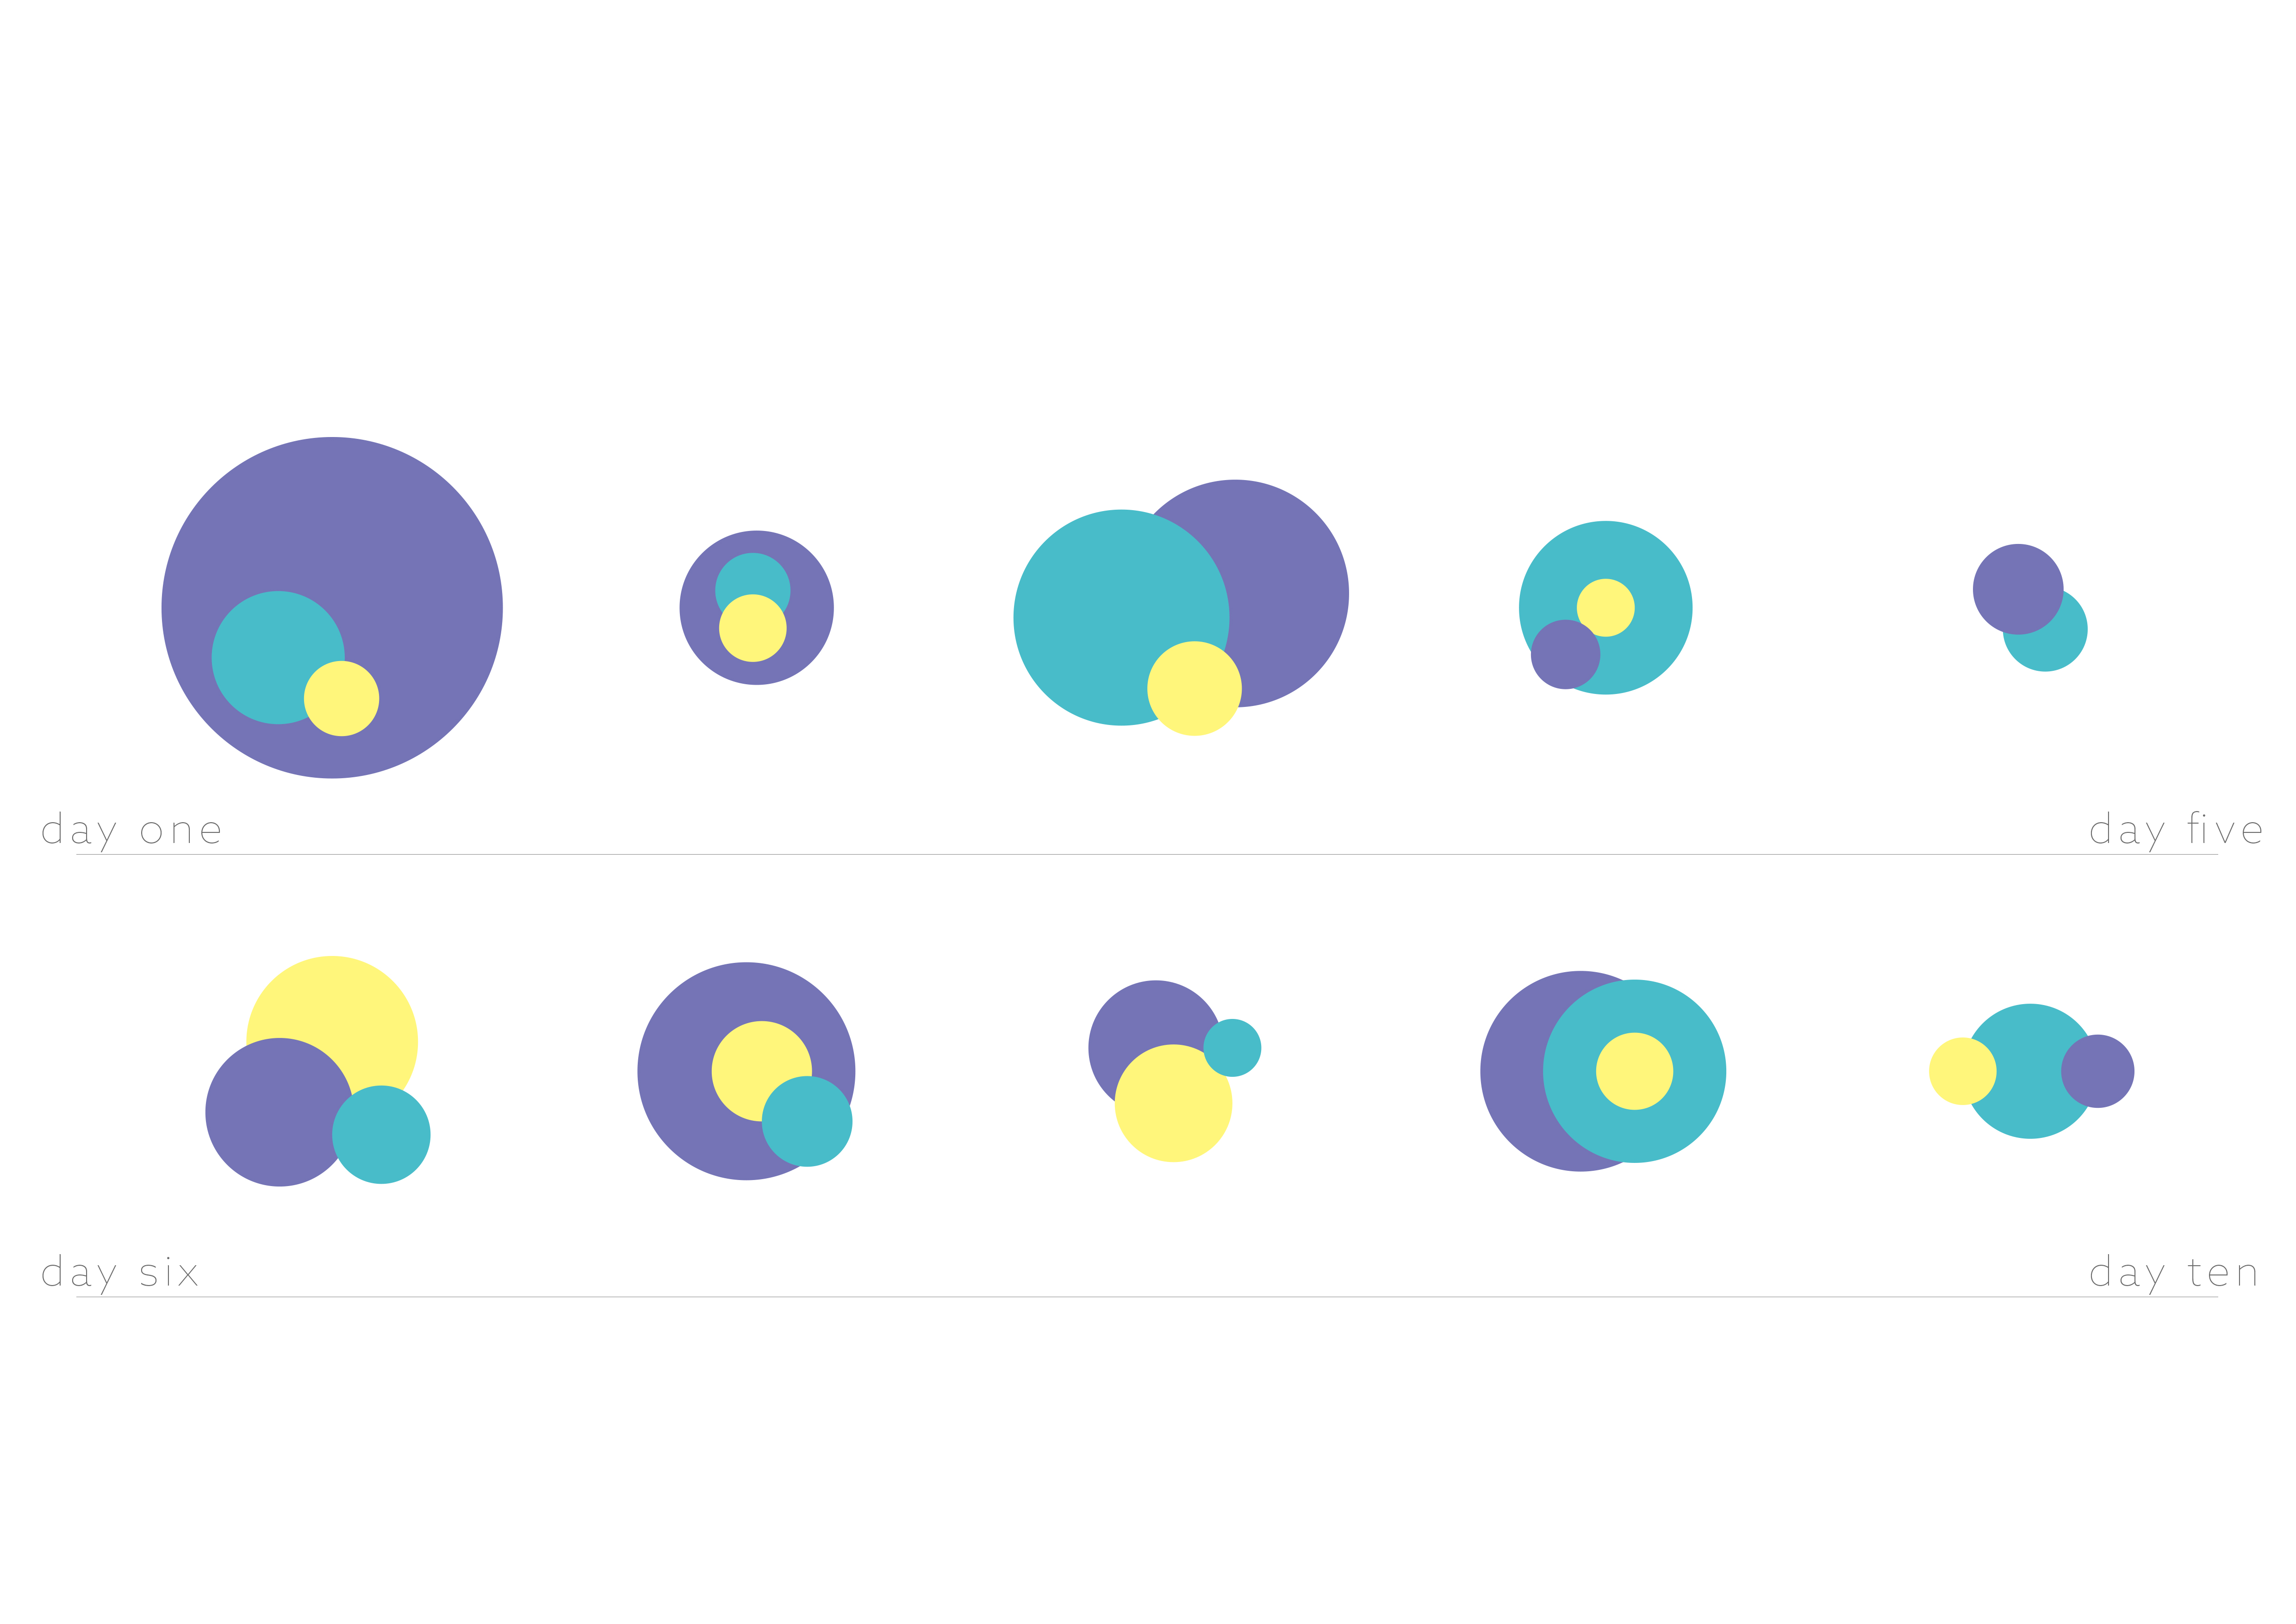
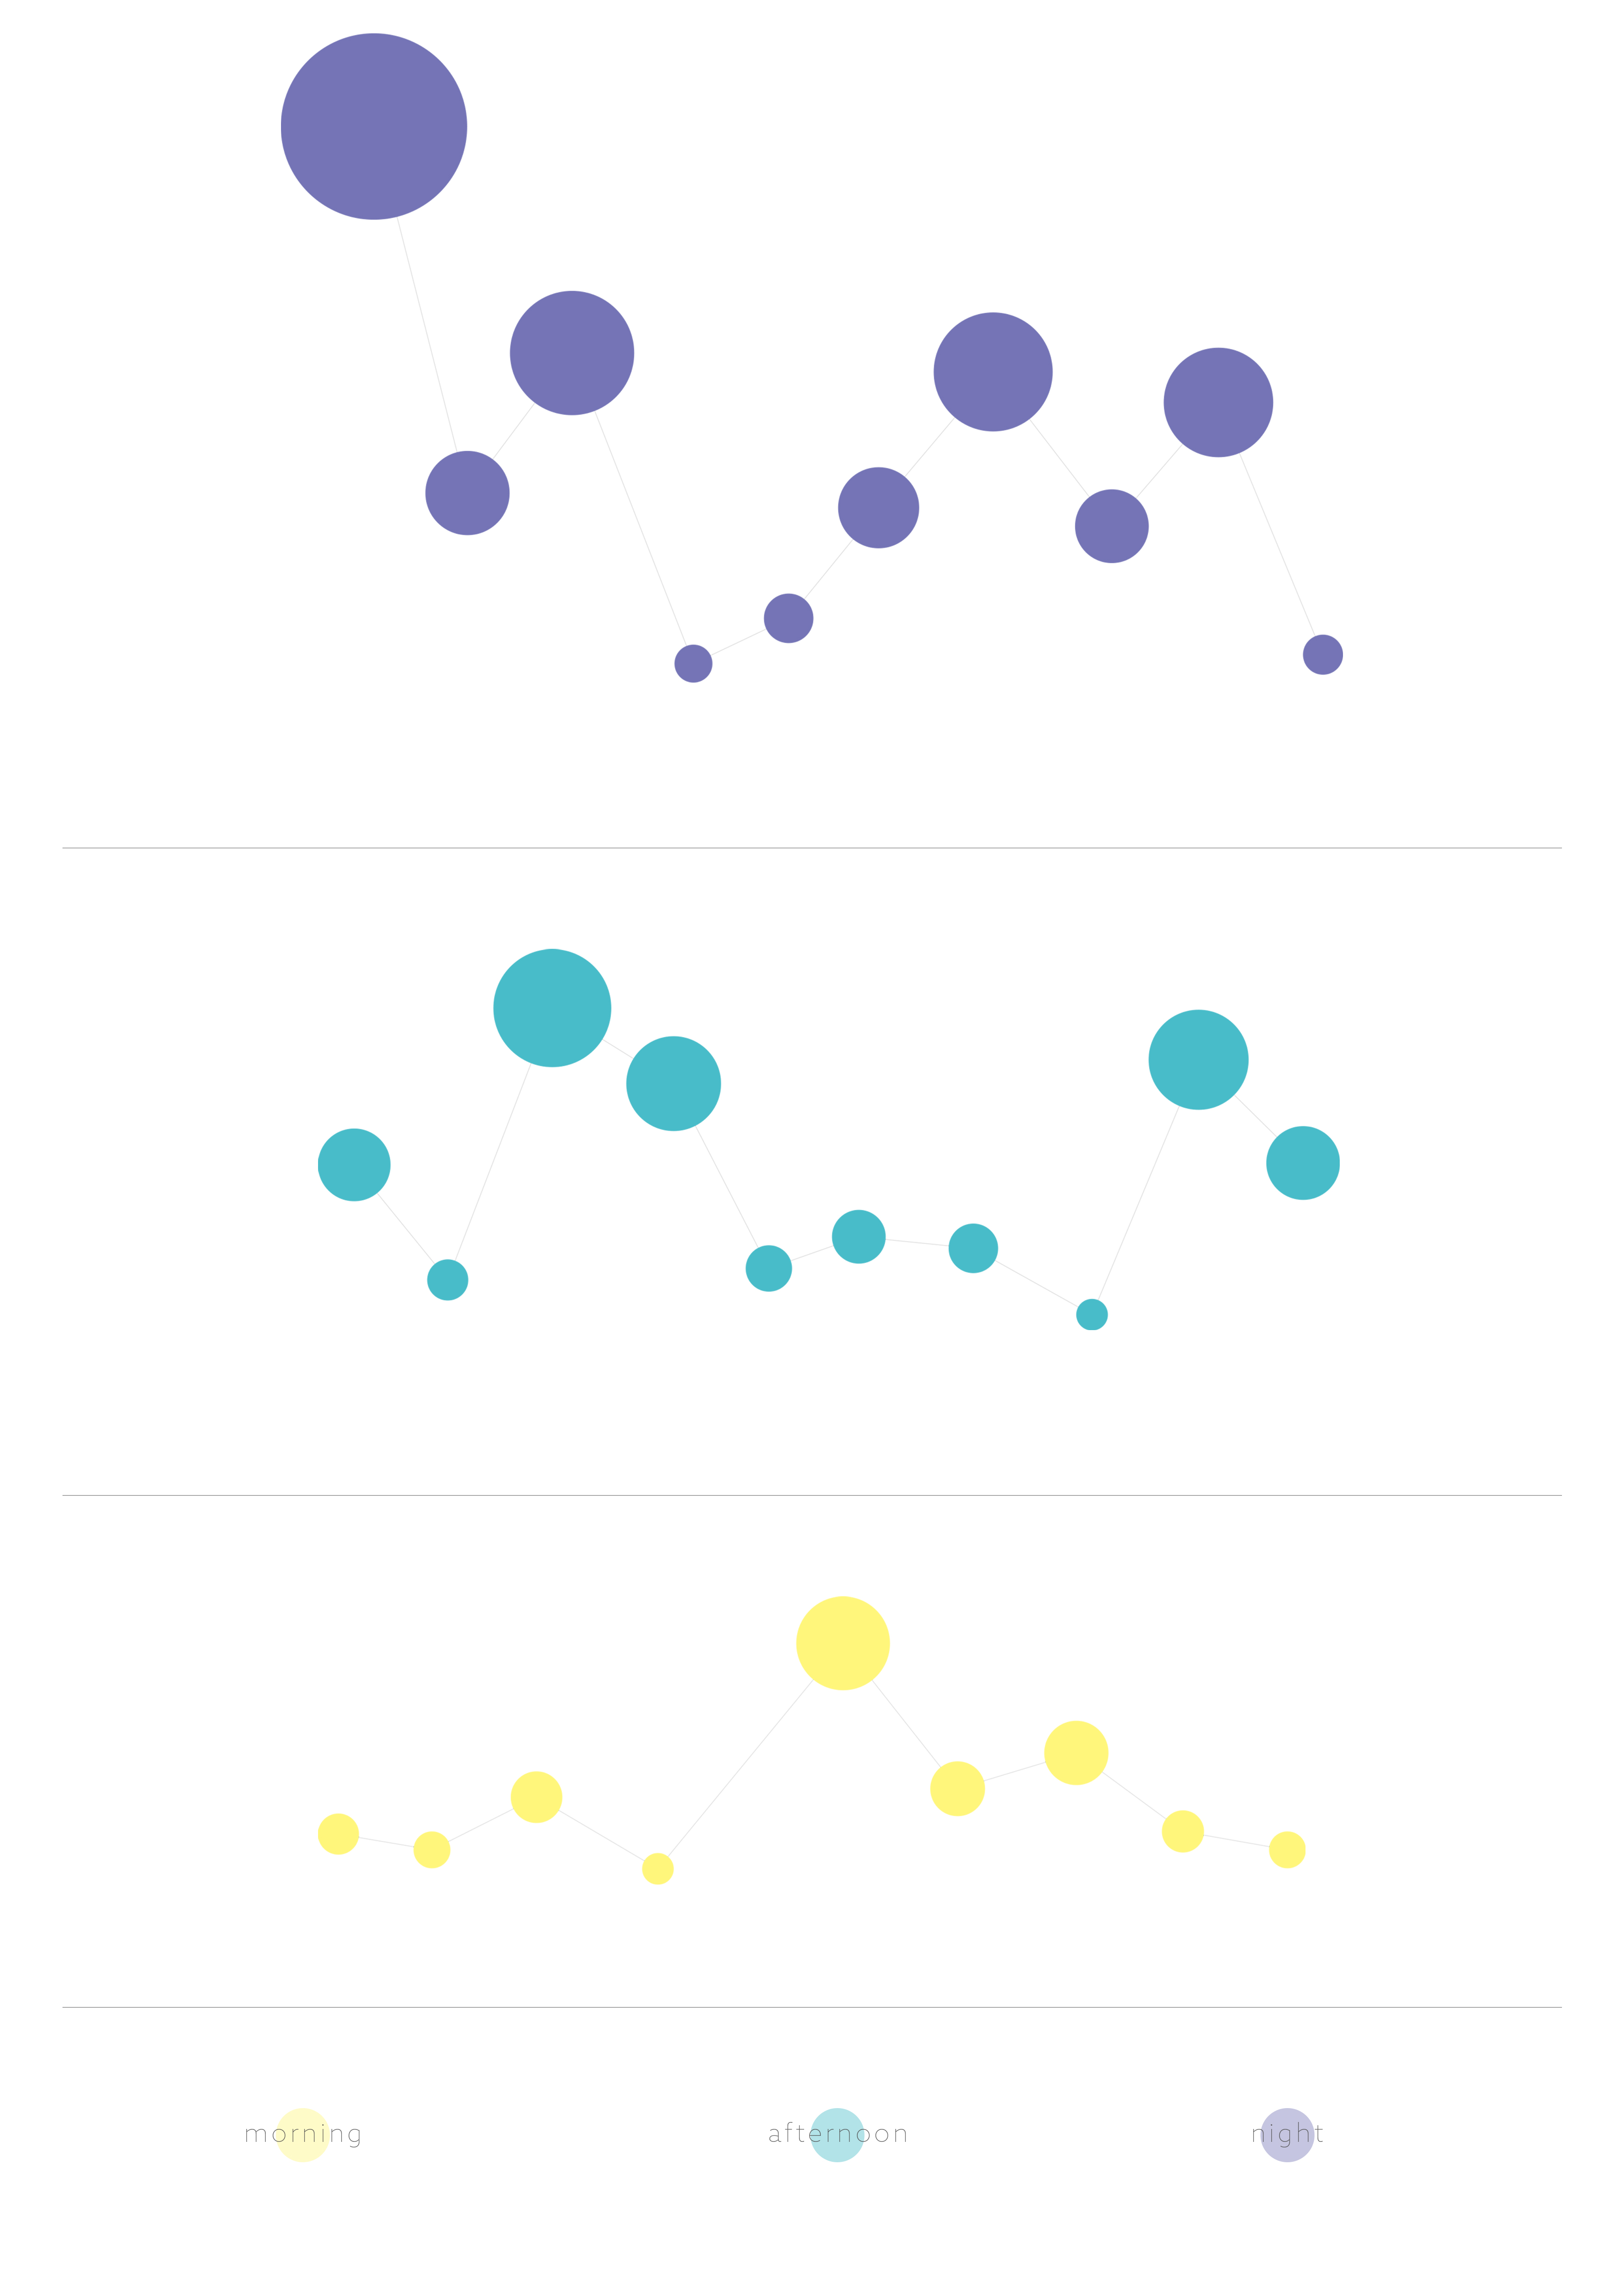
This third year assignment was to collect data, analyse it and eventually visualise that data. Over 10 days I collected data relating to how many times I pressed the home button on my iPhone. A few examples of the visualised data can be seen below.